The third quarter of 2025 sparked renewed debate across the credit union movement: why do so many merged credit unions show negative earnings, especially when acquired bank targets appear far more consistently profitable?
The short answer is that this is not an apples-to-apples comparison of “credit unions versus banks.” It’s a comparison of target pools—and target pools behave differently. But the longer answer is more useful for boards and executive teams: the data highlights the growing importance of scale, the compounding impact of operating leverage, and an under-discussed structural issue facing smaller institutions—membership decline.
For a quarter-specific view of the merger environment, including third-quarter dynamics, see our related post:
https://ceoadvisory.com/credit-union-merger-analysis-third-quarter-2025/
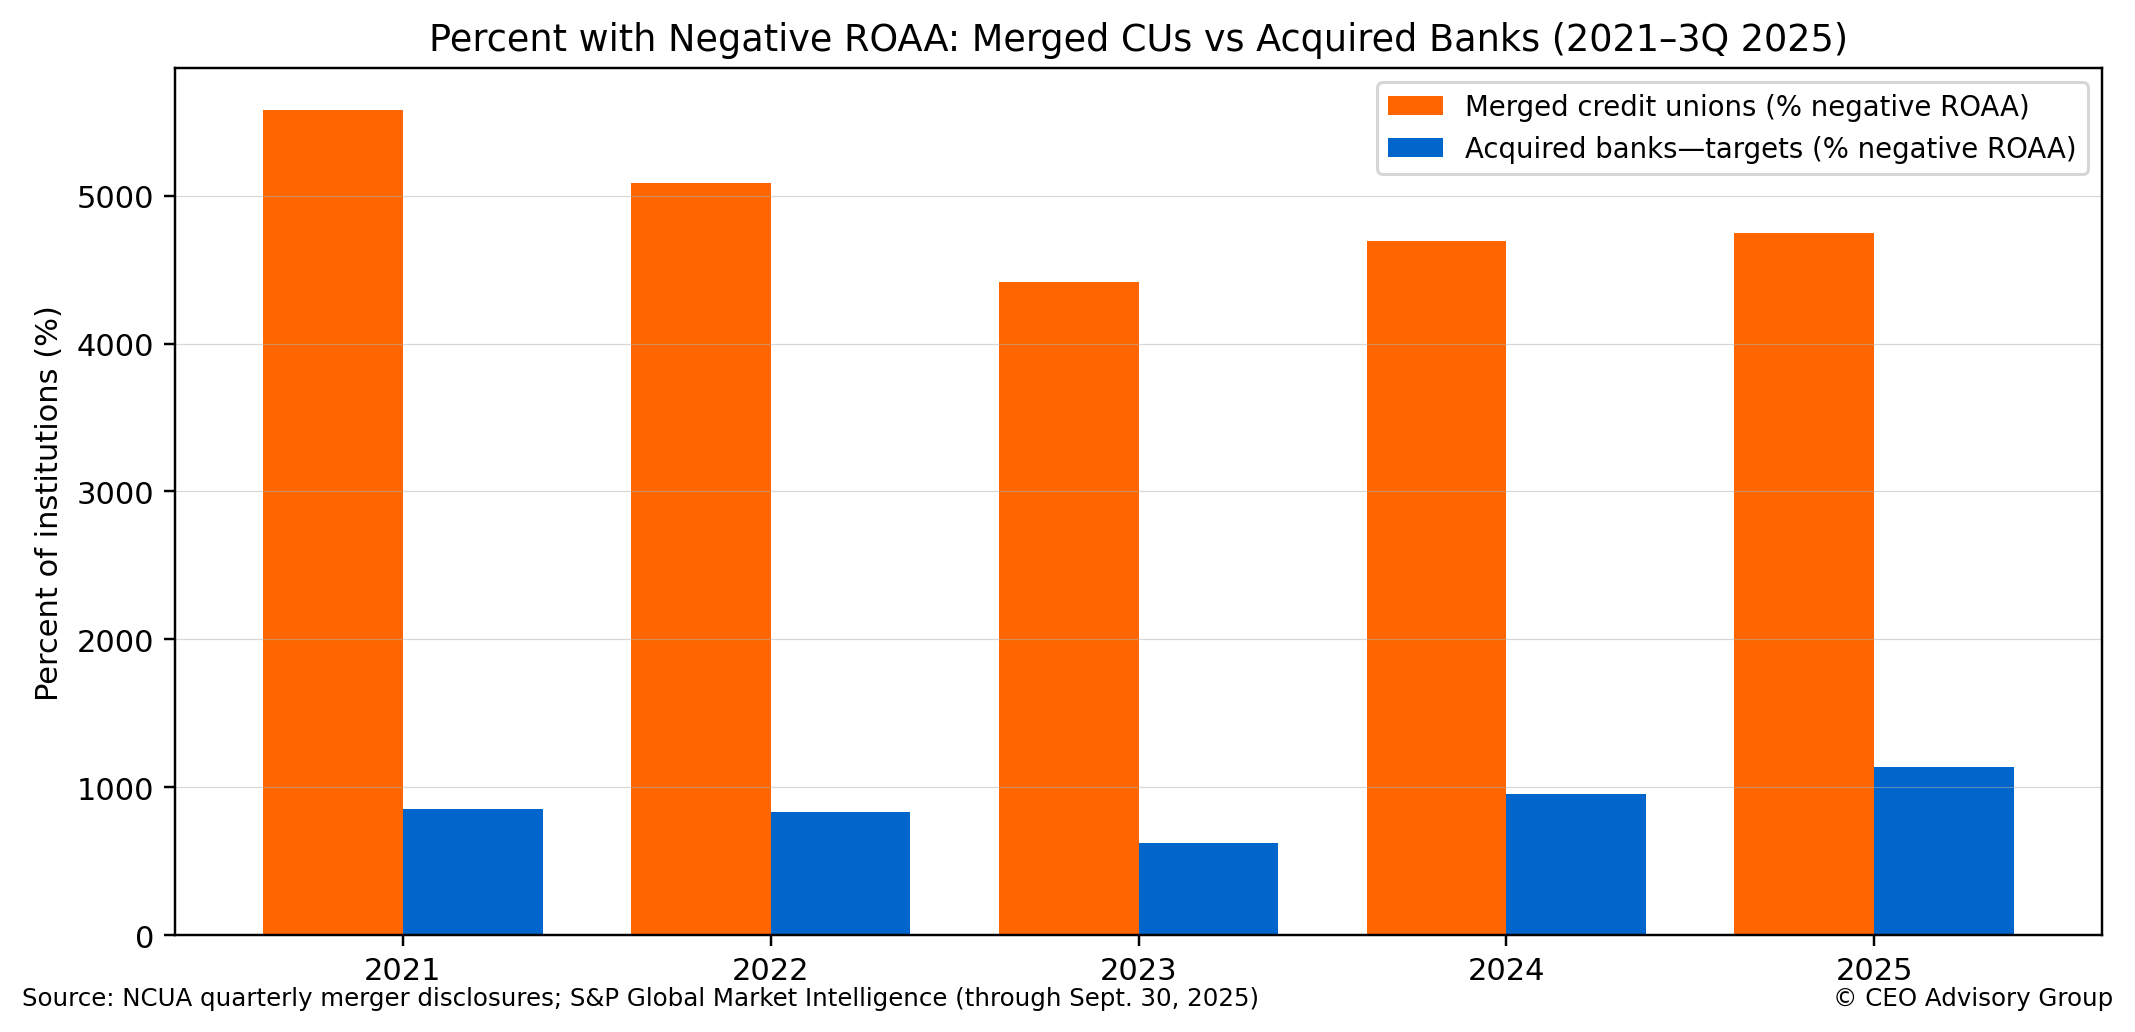
From 2021 through 3Q 2025, the share of merged credit unions with negative ROAA remained consistently elevated. Over the same period, acquired bank targets showed single-digit to low-teens loss incidence.
This gap is persistent for a reason: the credit union merger target pool includes a disproportionately high share of institutions solving for scale constraints, fixed-cost intensity, and leadership depth. In contrast, bank targets that transact are more often filtered by profitability and shareholder expectations.
It is also important to note what this comparison is not. It is not evidence that “credit unions perform worse than banks” in general. It is evidence that the merger pool contains more institutions facing structural headwinds—and those headwinds are becoming more common as the operating environment demands larger investments in technology, delivery, compliance, and specialized talent.
This is consistent with a theme we have addressed elsewhere: more mergers are occurring for strategic reasons, not solely for financial distress: https://ceoadvisory.com/more-mergers-occurring-for-strategic-reasons-rather-than-financial-distress/
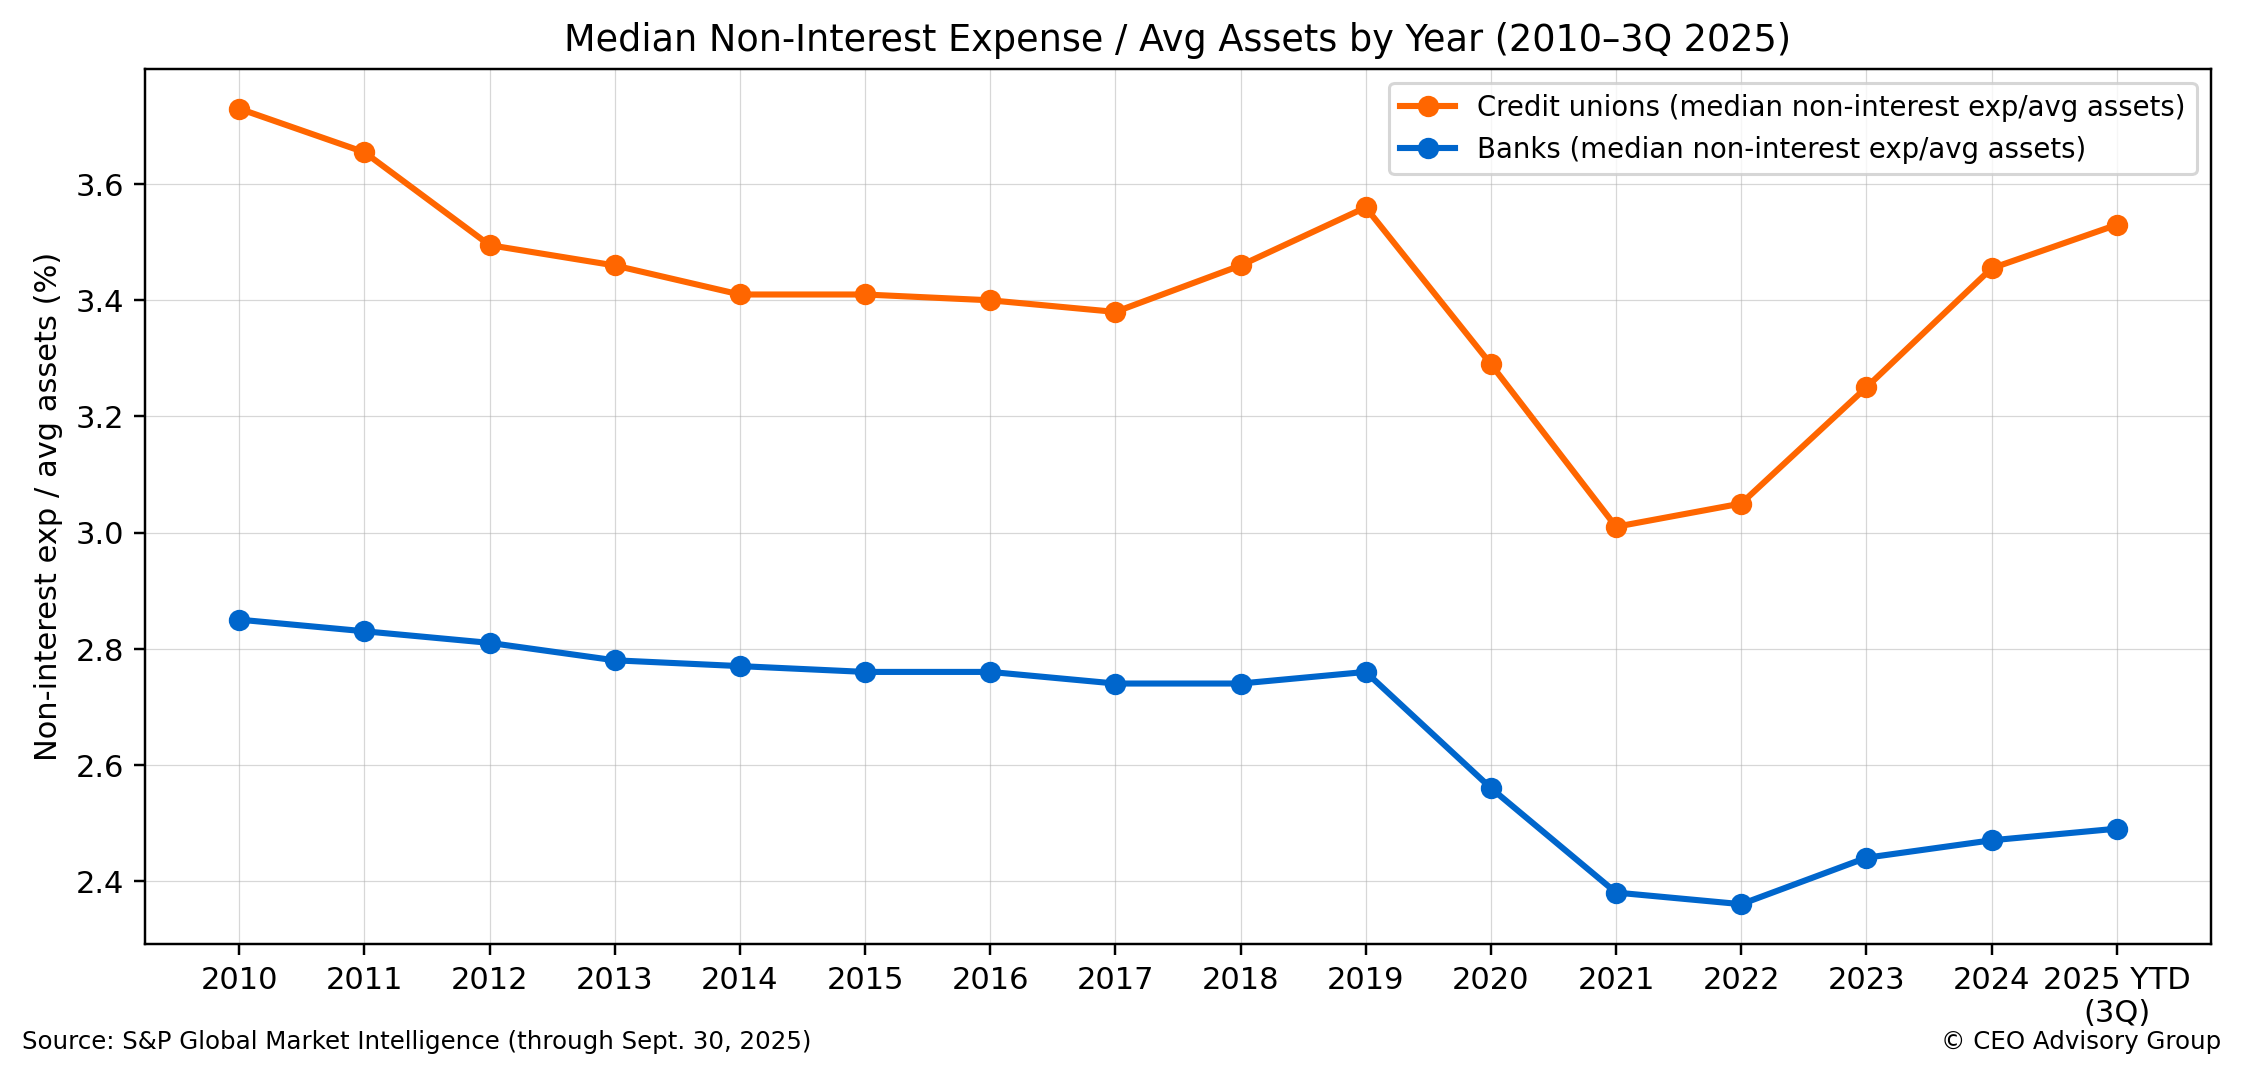
If you want one visual that explains a large share of the long-run ROAA conversation, it is the operating expense trend. Across the cycle, non-interest expense (as a percent of average assets) has remained a persistent differentiator. Even when credit unions demonstrate competitive margin performance, higher operating expense intensity can absorb much of that advantage—especially at smaller scale.
This is the operating leverage equation in practice: the more fixed costs an institution carries (technology, compliance, delivery, cybersecurity, specialized talent), the more it needs scale to spread those costs. When scale is insufficient, earnings pressure builds and strategic flexibility narrows—often leading boards to consider partnership or merger options.
This point reinforces an ongoing theme for leadership teams: institutions must continuously evolve to thrive:
https://ceoadvisory.com/credit-unions-must-evolve-to-thrive/
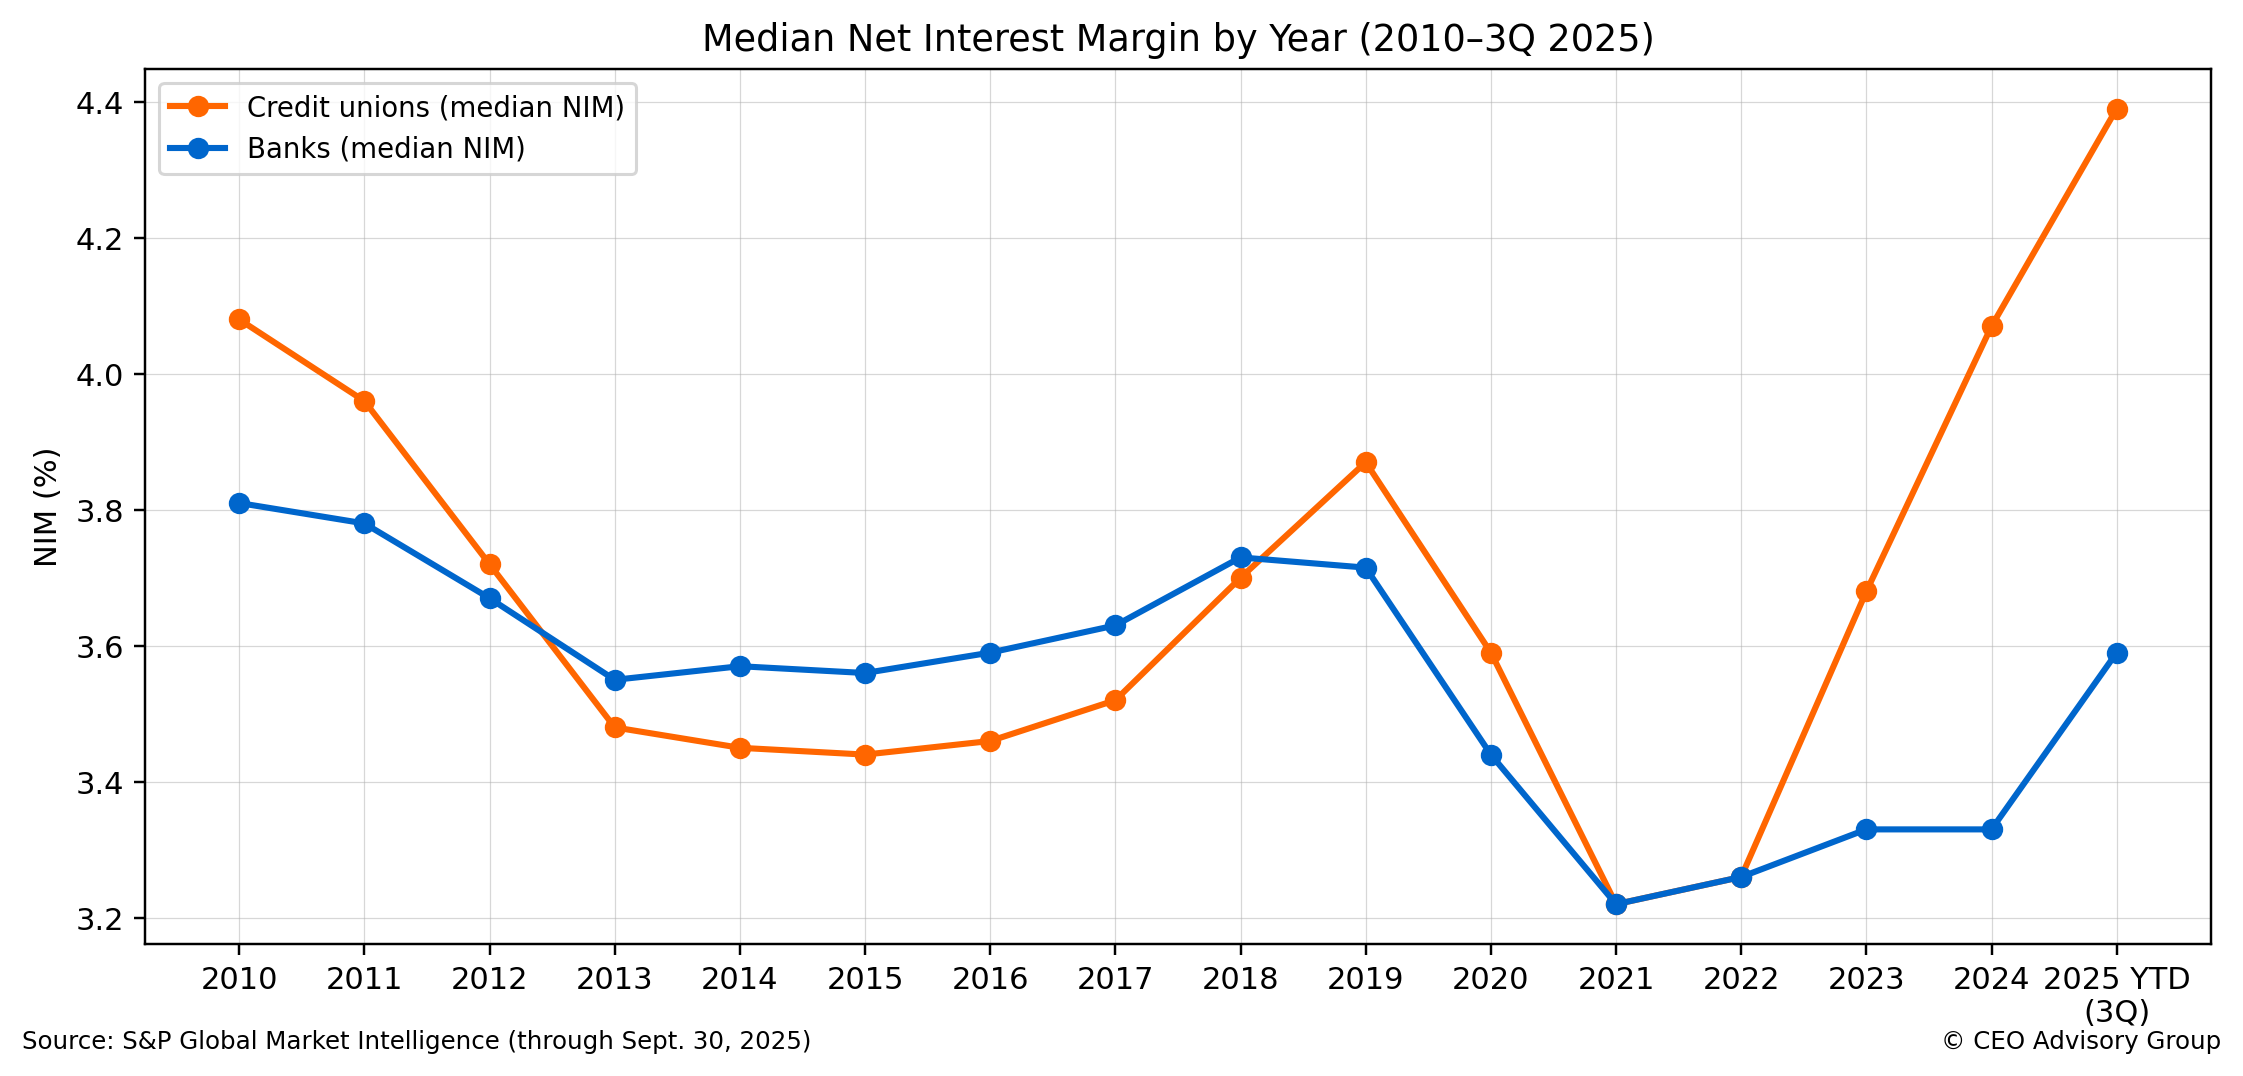
Margin discussions can become misleading without mission context. Banks are designed to optimize earnings for shareholders/owners. Credit unions are designed to enhance member financial well-being. That distinction matters when interpreting margins.
Credit unions frequently deliver member value by maintaining competitive loan rates and deposit rates. In that framework, some degree of “margin compression” can reflect value being passed through to members, not necessarily poor discipline. This does not eliminate the need for strong performance—boards still need sustainable earnings capacity to reinvest in the franchise—but it does reshape how we interpret the metric.
Board lens: Margin is not a moral scorecard. In a member-owned model, pricing discipline should be evaluated alongside member value, capital formation, and the institution’s long-run reinvestment requirements.
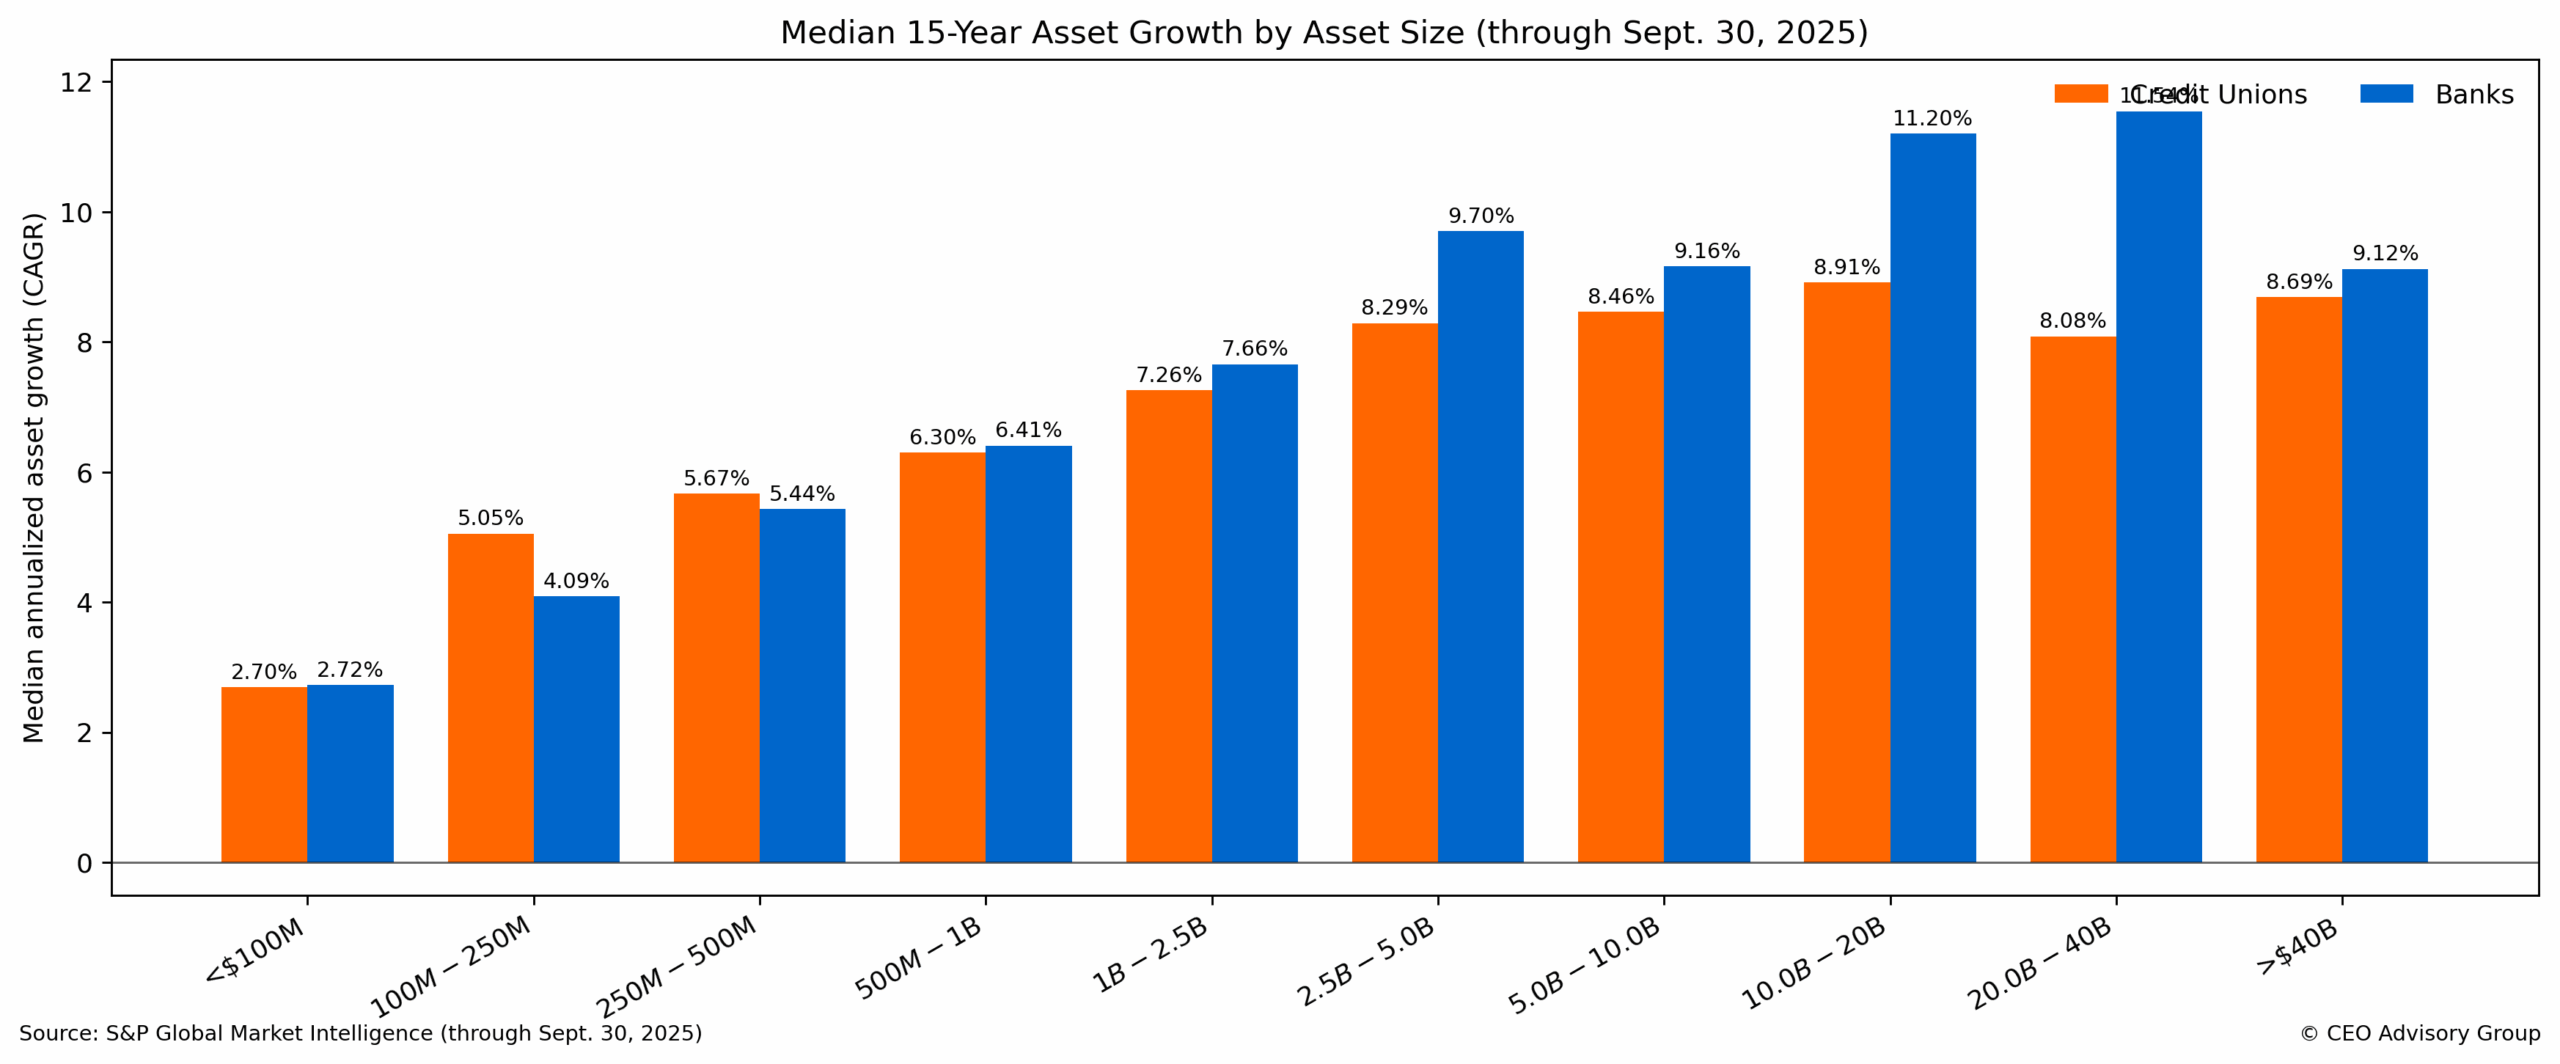
Asset growth comparisons also require a structural lens. Banks generally have broader access to external capital (common equity issuance, preferred capital, and other tools) that can support balance-sheet growth. Credit unions are primarily constrained to retained earnings to build net worth and fund organic growth.
This constraint can create sharper tradeoffs in periods of investment intensity. When a credit union must choose among (1) competitive member pricing, (2) technology and delivery reinvestment, (3) talent and risk-management depth, and (4) earnings capacity to build net worth, the growth path becomes more complex—particularly at smaller scale.
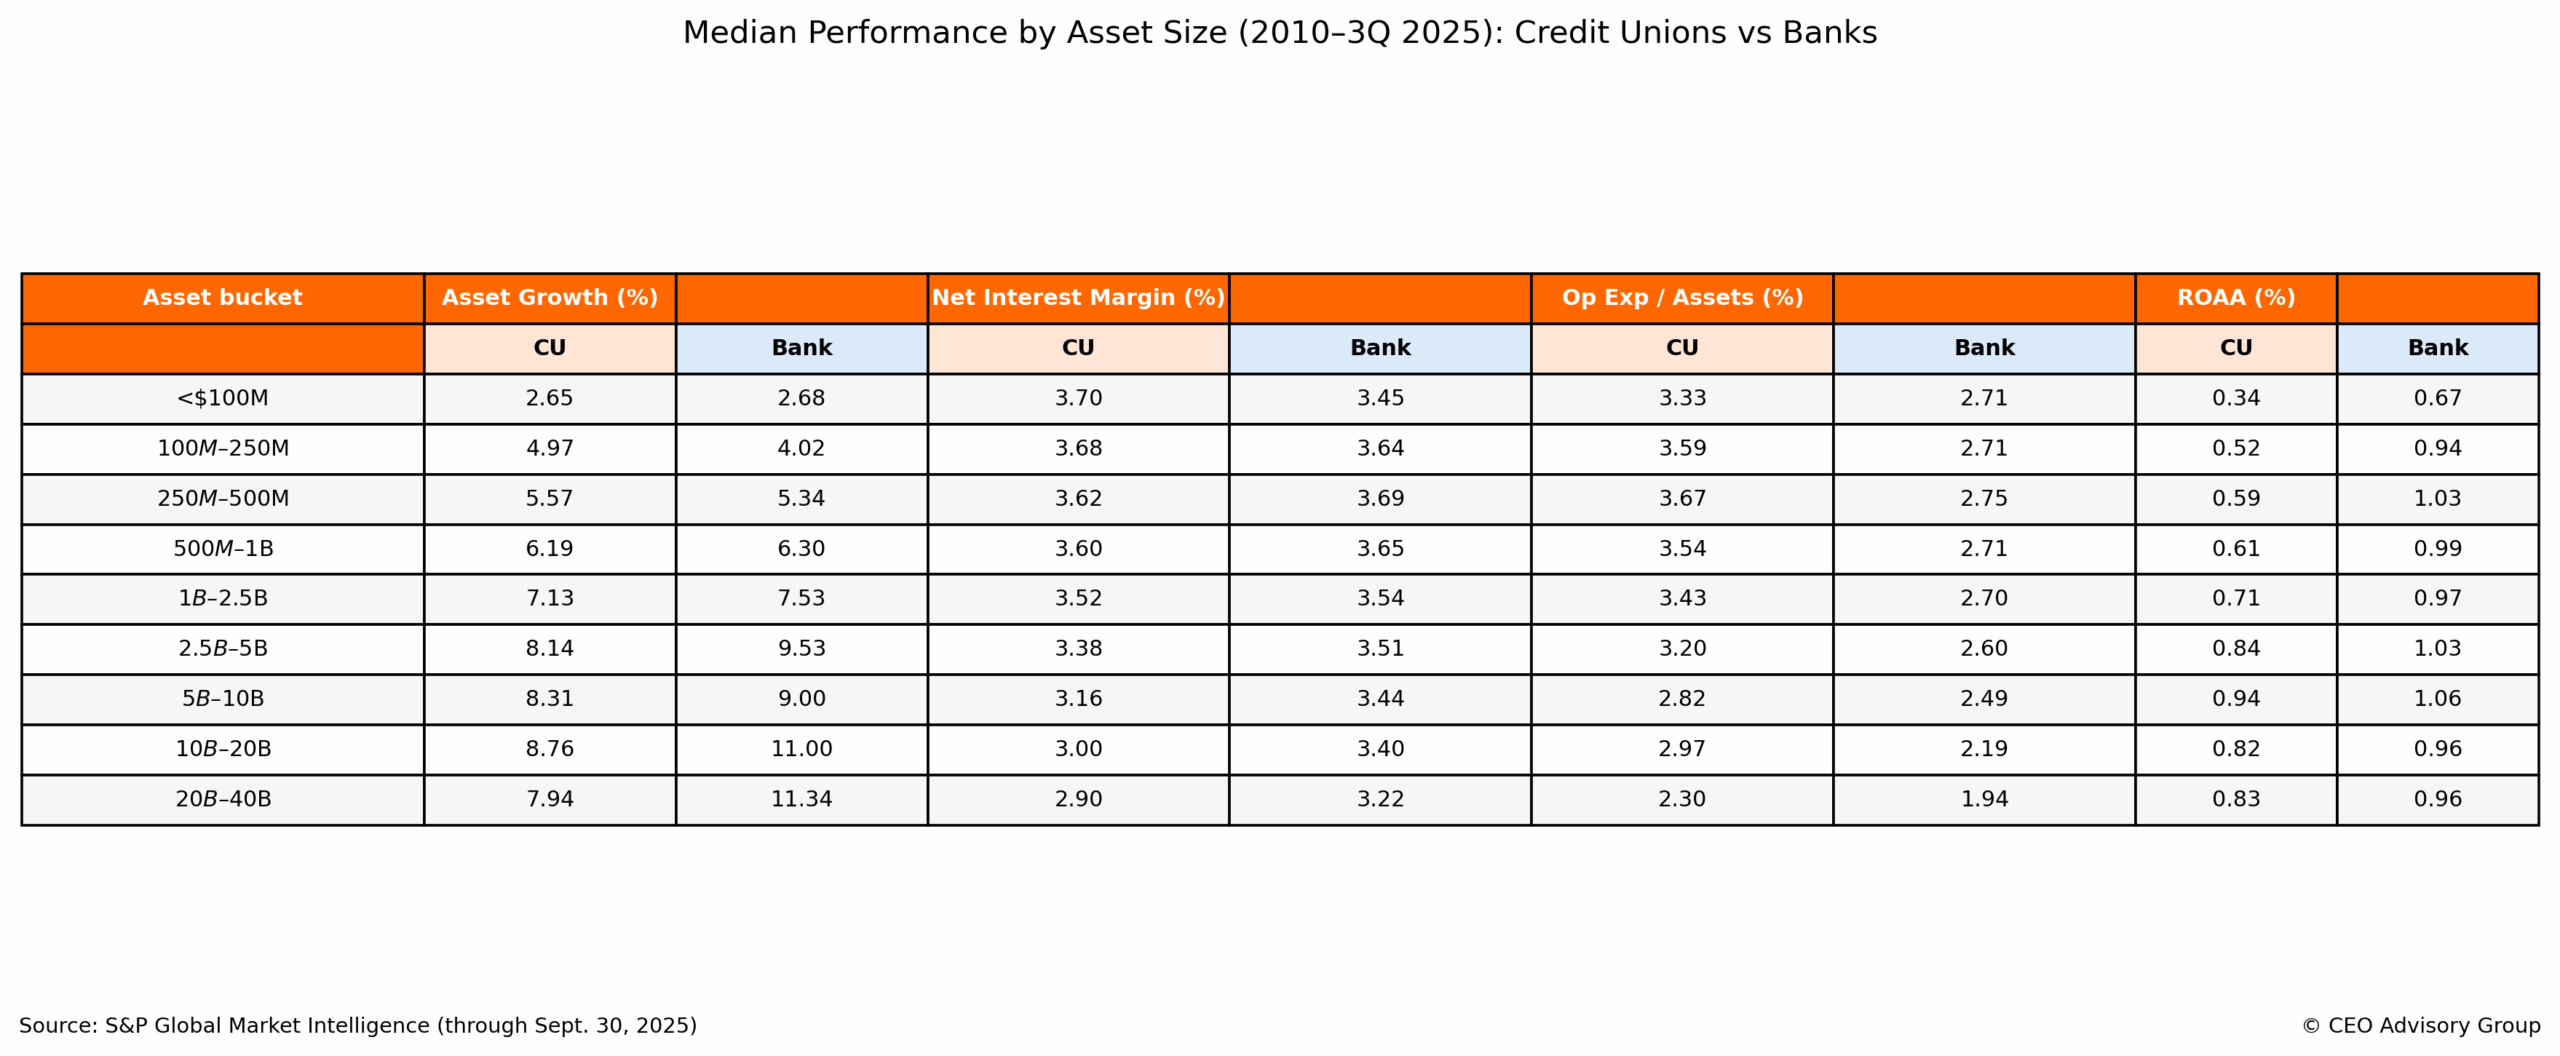
The 15-year growth chart shows that below $500M, credit unions generally match—and in some tiers modestly exceed—banks’ median asset growth. At this size, banks’ ‘capital access’ is often more theoretical than practical: thin liquidity, limited investor demand, and the cost/dilution of issuing capital can make growth largely dependent on retained earnings. Credit unions are also earnings-funded, but full earnings retention and member-based growth pathways—including strategic combinations—can help offset the small-bank capital constraint and narrow (or even reverse) the growth gap at smaller scale.
Operating leverage is not only an expense story—it is also a demand and relevance story. When membership shrinks, the fixed-cost equation becomes harder to solve, and the strategic path back to sustainable independence narrows.
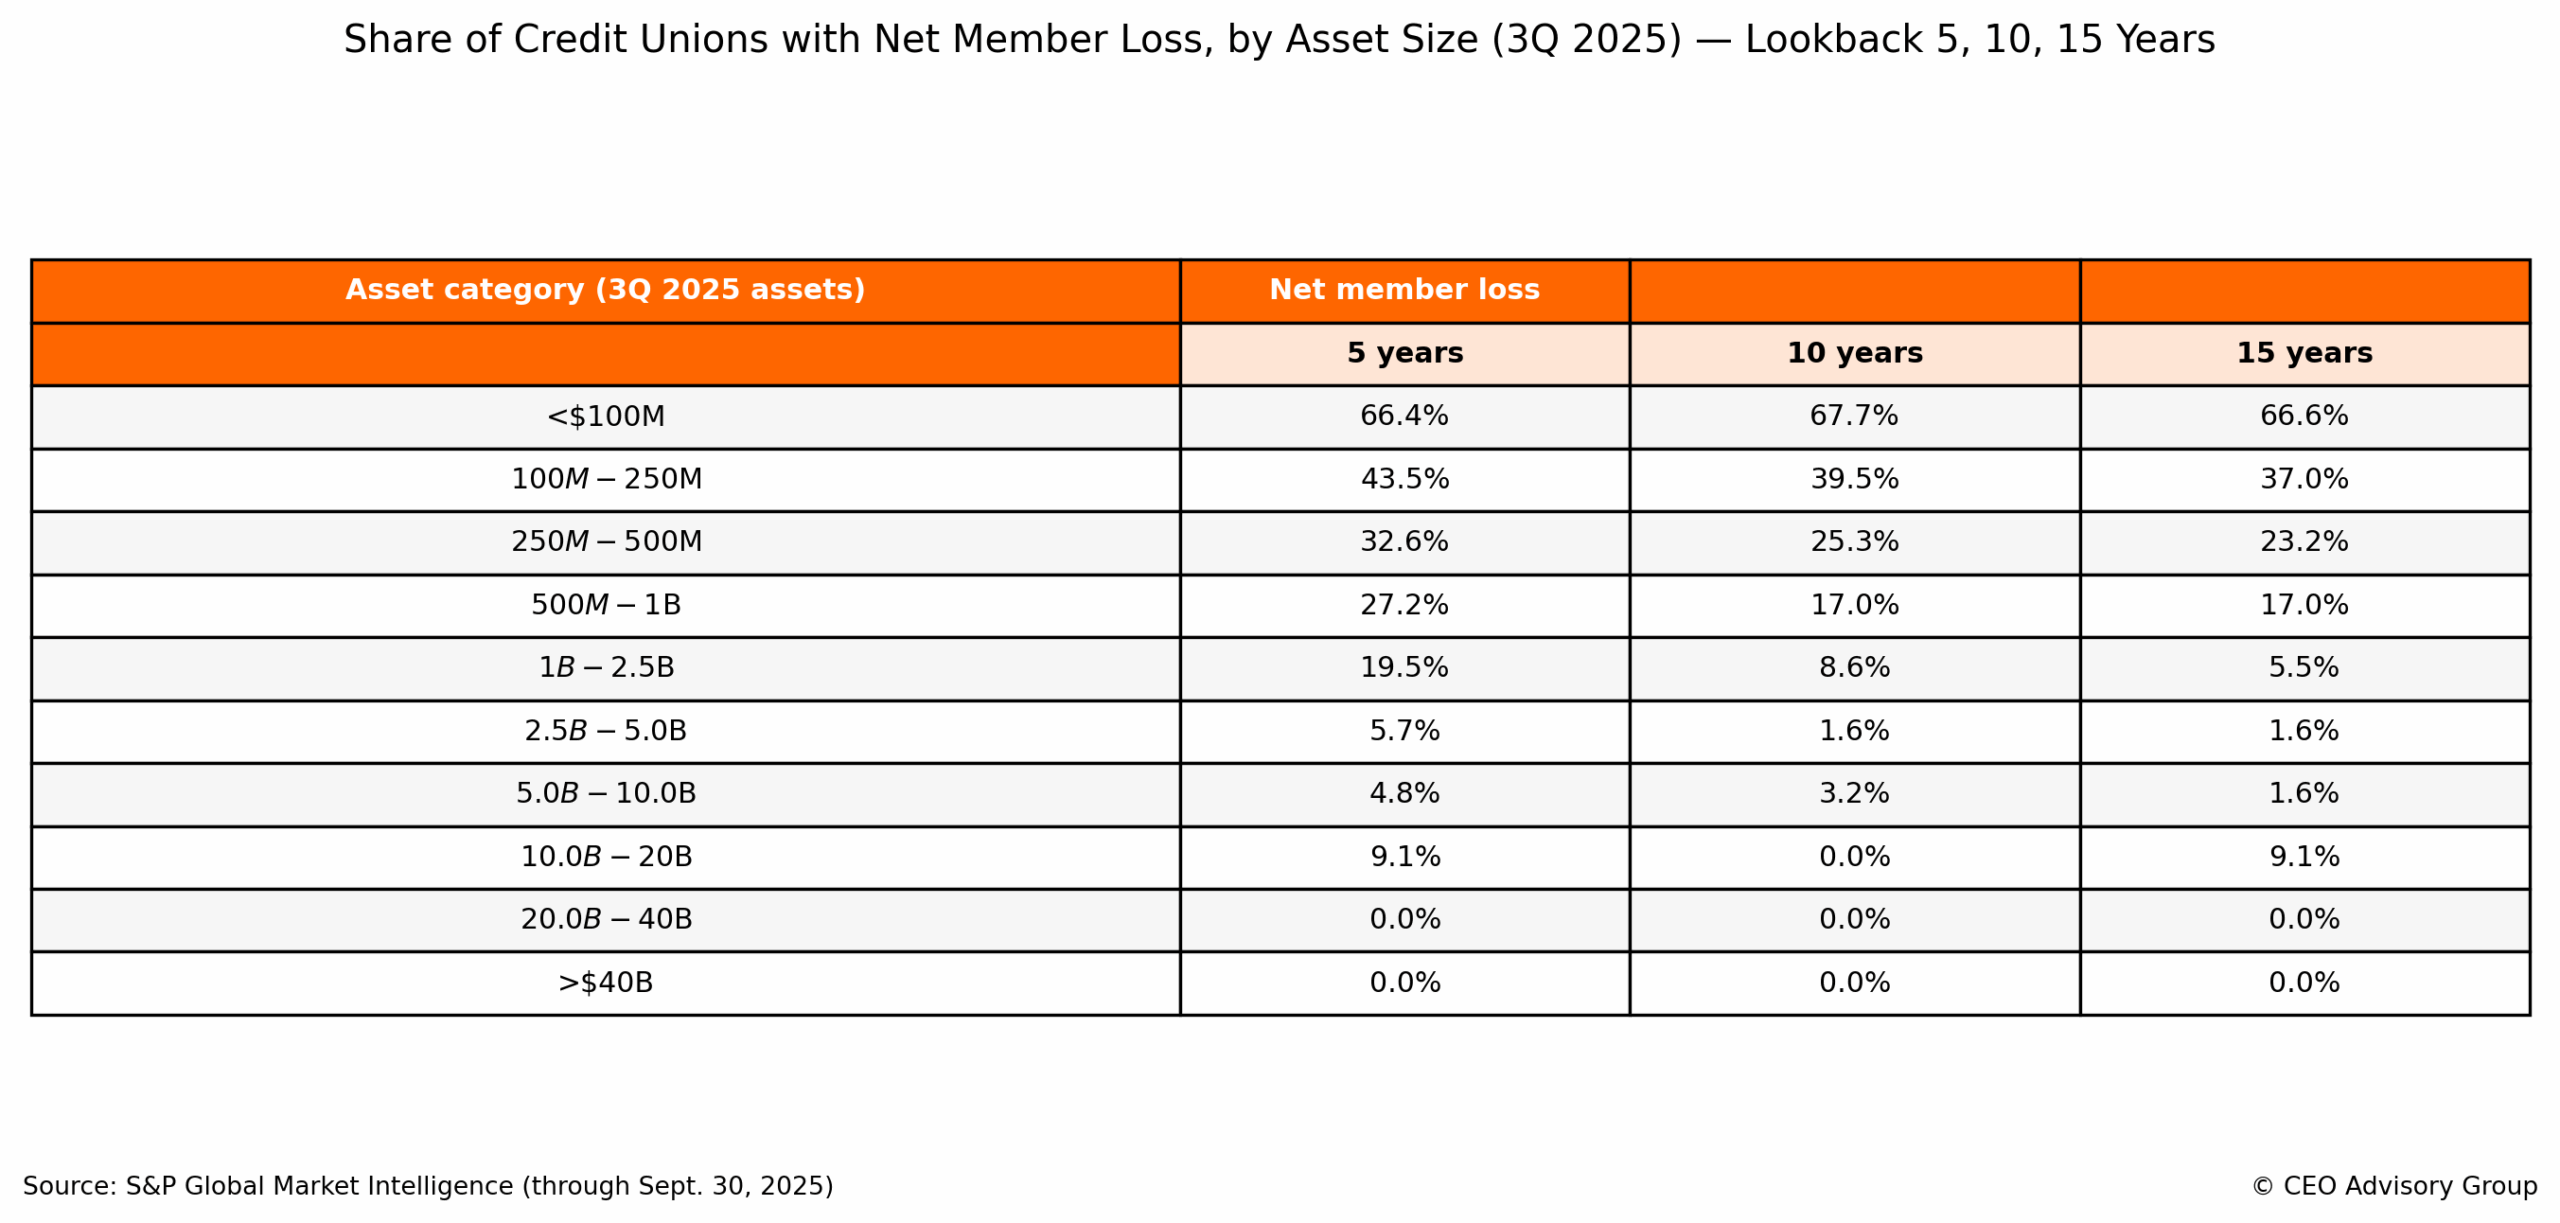
Our analysis of membership trends ending in 3Q 2025 shows a stark size-based pattern: membership decline is concentrated in small institutions. Roughly two-thirds of credit unions under $100M in assets experienced a net loss of members over the last 5, 10, and 15 years. By contrast, large institutions show far lower rates of sustained membership contraction.
Why membership decline is such a powerful structural driver:
This is also why many mergers are best understood as a strategic response—not simply a financial rescue. For additional context on leadership and continuity considerations:
https://ceoadvisory.com/strategicsuccession/
Performance tends to improve with scale across multiple dimensions. The table below summarizes long-run median performance by asset size (2010–3Q 2025): asset growth, margin, operating expense, and ROAA.
A few observations stand out:
Board takeaway: Scale is not just about getting bigger. It is about sustaining the reinvestment capacity required to remain relevant while delivering member value and maintaining capital strength.
Bank acquisitions provide a useful “market clearing” benchmark for how earnings power and franchise quality translate into price. While any single deal can be driven by unique circumstances (market concentration, deposit franchise strength, branch footprint, credit marks, cost saves, and competitive tension), the broader dataset tends to price one central question: how durable are a target’s earnings relative to its tangible capital base?
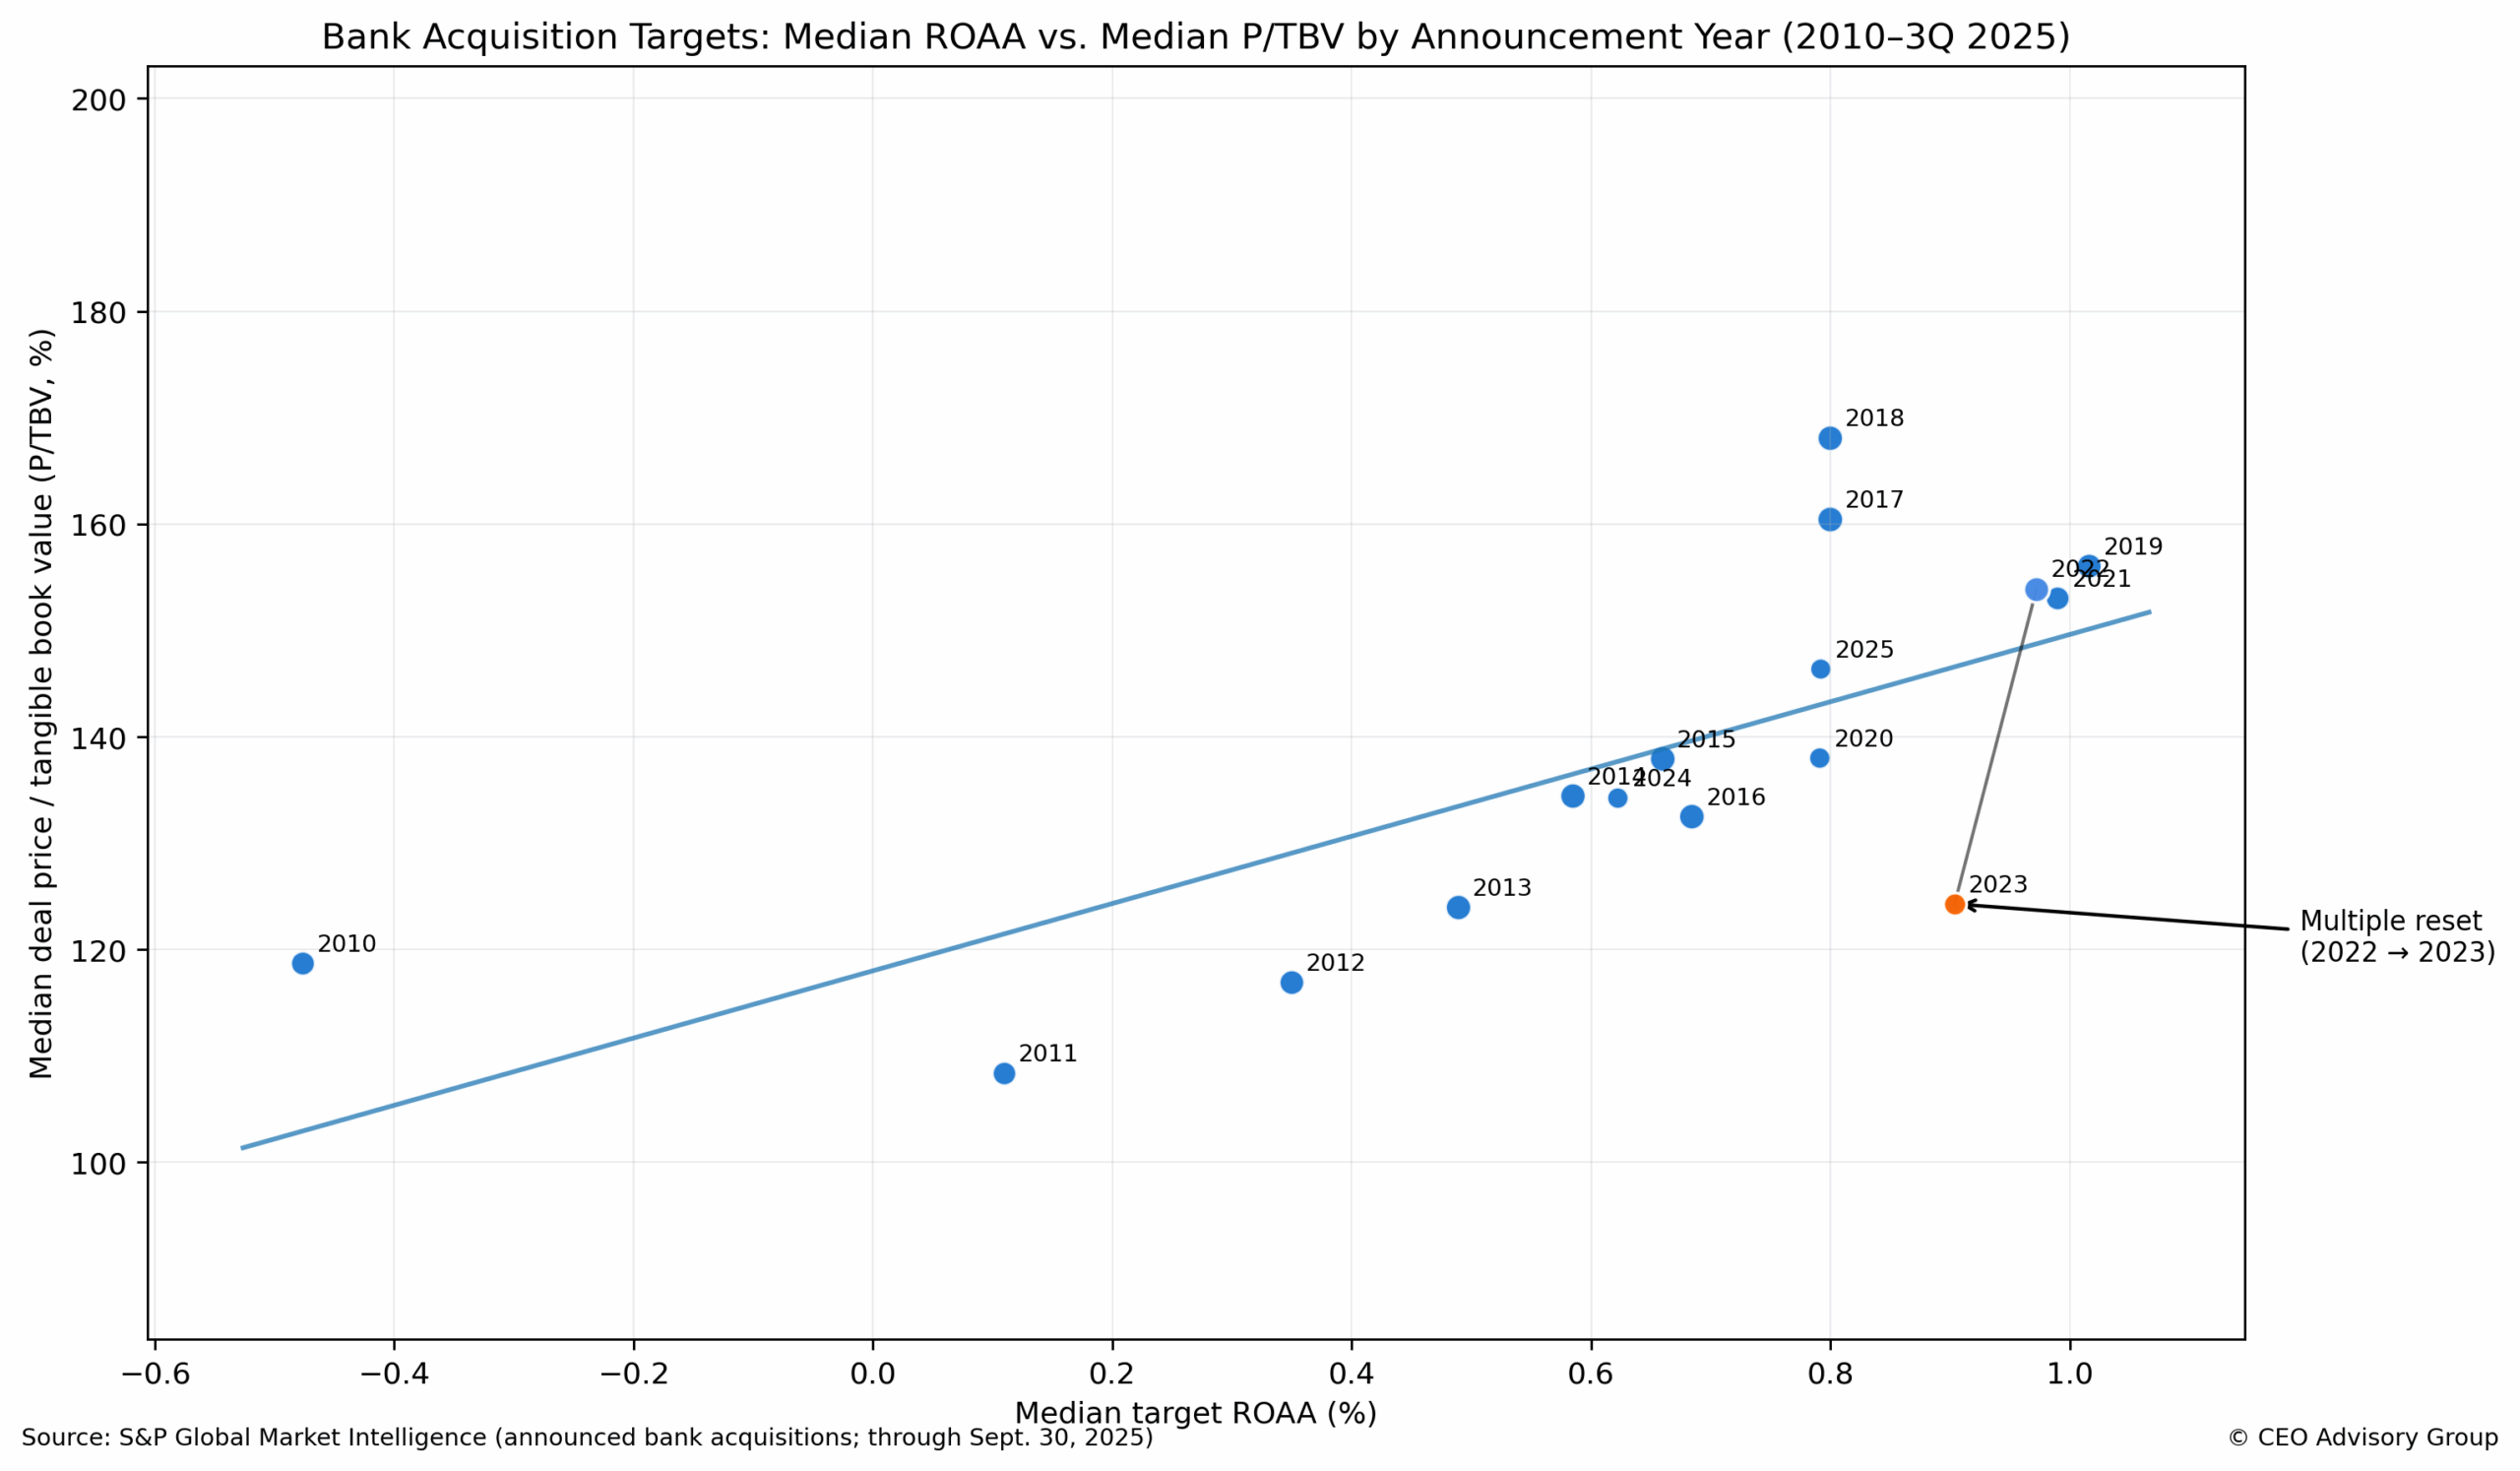
The scatter plot below summarizes that relationship at the annual median level. Each point represents a year (2010–3Q 2025) and plots:
X-axis: median target ROAA for announced bank acquisitions
Y-axis: median deal price / tangible book value (P/TBV)
Bubble size: number of deals in that year with both ROAA and P/TBV available
Interpretation: across most years, higher ROAA corresponds with higher P/TBV. In other words, when targets are more profitable, buyers tend to pay higher tangible book premiums—because they expect stronger “earn-back” and higher post-close ROE.
What stands out in the figure is the 2022 → 2023 step-down in pricing multiples. Even with target ROAA holding up reasonably well, median P/TBV resets lower in 2023—an important reminder for boards that pricing is not driven by target performance alone. Macro conditions can change the market’s “clearing multiple” by shifting risk premiums, funding assumptions, and the buyer’s own cost of capital.
This is also why year-by-year pricing tables can look confusing: ROAA may remain stable while multiples move materially. The scatter makes the point more clearly: profitability explains pricing directionally, but “the regime” sets the valuation level.
For credit unions evaluating external growth, bank acquisitions remain a compelling scale-and-capability pathway, particularly for institutions with the operational capacity to integrate banking systems, staff, and risk frameworks. A bank acquisition can accelerate:
Market entry or market share expansion (new footprint, expanded branch density)
Commercial capabilities (C&I lending, treasury management, SBA, specialty verticals)
Deposit franchise diversification (business operating accounts, broader deposit mix)
Talent acquisition (relationship teams, credit expertise, and operations depth)
And importantly, the “multiple reset” dynamic can create windows of opportunity: disciplined pricing environments often allow strong acquirers to buy franchise value at more reasonable tangible book premiums than would be available in peak valuation years.
One reason credit unions have remained active bank acquirers through volatile periods is structural: most credit unions do not have publicly traded acquisition currency and therefore execute bank deals as cash transactions. In a challenging valuation environment—when bank stocks are volatile or depressed—cash consideration can be attractive to sellers because it:
reduces execution risk tied to the acquirer’s stock price,
simplifies valuation negotiations, and
can improve overall certainty and speed to close.
That matters in “risk-off” markets. When bank-to-bank deal activity slows due to weak stock currency or heightened dilution/earnback sensitivity, credit unions’ cash-buyer posture can help sustain activity, particularly for sellers prioritizing certainty and clean value realization.
The scatter plot is a useful tool for boardrooms because it links two realities that are often discussed separately:
Targets with stronger ROAA tend to command higher tangible book premiums, because buyers are paying for earnings durability and franchise quality.
Market regimes can override fundamentals, resetting multiples even if ROAA remains solid—making timing, structure, and buyer capability just as important as the target’s standalone performance.
For a deeper discussion of how credit unions are reshaping the bank M&A landscape—and practical considerations in evaluating bank opportunities—see:
https://ceoadvisory.com/bank-acquisition-boom-how-credit-unions-are-changing-the-ma-landscape/
And the companion white paper (board-ready framework) is available here:
https://resources.ceoadvisory.com/bank-acquisition-whitepaper.html
If you want, I can also add a one-sentence caption under the scatter that explains the 2022→2023 reset in plain English (without getting too “macro”), consistent with your blog style and cadence.
If the data in this post resonates, the next step is not to chase a single ratio. The next step is to pressure-test the institution’s long-run independence path. A practical board agenda includes:
The 3Q 2025 earnings headline is real—but it is explainable. The credit union merger target pool includes a greater share of institutions under structural pressure from fixed costs, limited operating leverage, and persistent membership decline. At the same time, credit union margins and growth rates should be interpreted through a member-owned lens: member value delivered through pricing can compress spreads, and growth must largely be funded through retained earnings rather than external capital.
For boards and executive teams, the implication is consistent: scale is increasingly the prerequisite for sustainable reinvestment, resilience, and long-run member value. The earlier a board evaluates its scale strategy options, the more choices it preserves.